Exercise 0a - Showing proteins from their best side
Exercises | | Links:
In this exercise you will visualise some nice protein properties.
PyMOL is a fantastic tool for the analysis of biological molecules, both for quick looks and more in-depth analysis. In this assignment we will use some simple tools to look at a structure and see how to change the graphical representation. The assignment deals with many of the same things you have seen in the video “Introduction to PyMOL”. Before you get started, you must of course have PyMOL installed on your computer (either Mac or PC) just as it is important to use a mouse with both right and left button as well as a middle wheel. The wheel must also have a button function when pressed (3-button mouse). If you do not have such a mouse, it is strongly recommended to acquire one as it is very difficult to control PyMOL from a laptop touchpad, especially on a Mac.
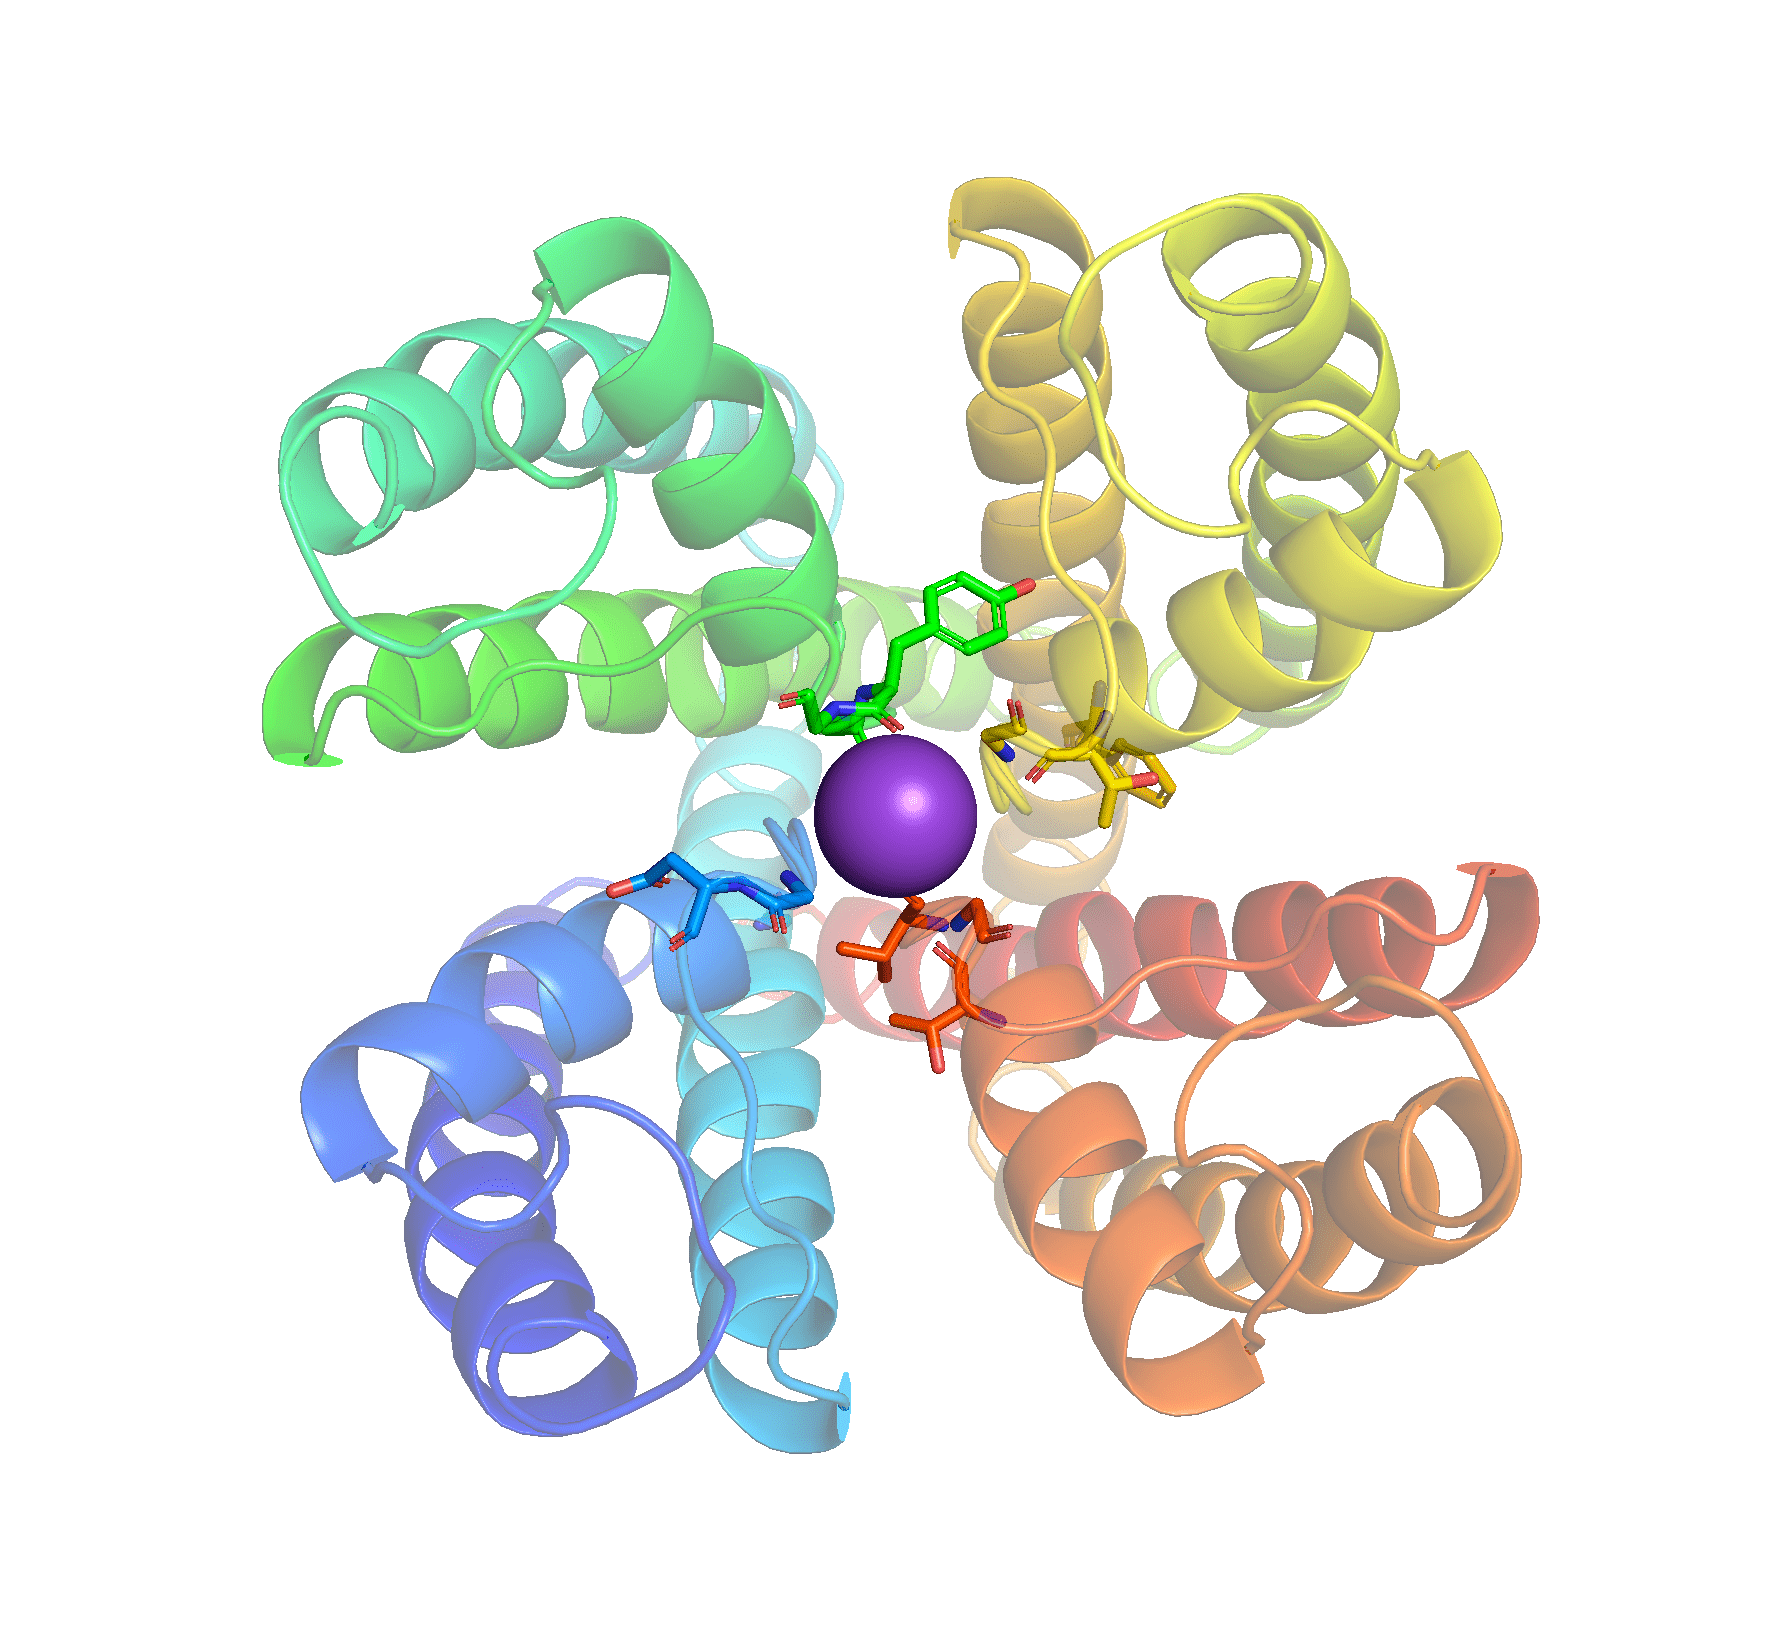
Task 1: Retrieve the structure of the K+ channel from Streptomyces lividans using PDB code 1BL8 by typing the command “fetch 1BL8”.
The right side of the Viewer window displays the downloaded PDB file as a PyMOL object with the same name as the PDB file. Objects can be recognised by the fact that the name is not in parentheses. Later, we will look at selections that are shown with their name in parentheses. The difference between the two is that objects contain molecular coordinates while a selection is just a set of atoms in an object, a selection does not contain the atoms, a bit like selecting some text in Word with the pointer. In other words, there must be an object before you can create a selection. Objects can be turned on and off by clicking on the name. At the top there is always a global object “all”, which covers all objects and selections in PyMOL. Making a change here will affect all objects below. After the object name it says “1/1” with green, which means that we look at state 1 out of a total of 1 state of the structure. This is always the case for crystal structures that are deposited only as single structures. For structures determined by NMR, one will typically experience that several low energy states are deposited, so there will be more states.
Task 2: Download the structure of the PAS domain from the HERG K+ channel determined by NMR via PDB code 2L0W. How many states have been deposited for this structure?
Task 3: Try switching between displaying the different states using the buttons at the bottom of the window
Next to each object or selection are 5 menus indicated by the letters A (Action), S (Show), H (Hide), L (Label), and C (Color). These can be used to control how the object / selection appears visually as well as perform various calculations on them. Under Actions, the most important functions are:
- orient - moves the object / section into the middle of the field of view
- center - sets the rotation center for the selection / object
- find - finds polar interactions in a selection / object or between them
- align - makes structural alignment of the selection / object
- rename - renames the object / selection
- delete - deletes the object / selection
- remove waters - removes water molecules for better overview
Task 4: Use the Action menu to delete the NMR structure and then to move 1BL8 into the center of view.
The Show menu is used to display objects / selections in different graphic representations, the most important of which are:
- (wire) lines - Shows all bonds as thin lines with atom colors in the corners.
- (licorice) sticks - Like lines, but with thicker sticks.
- ribbon - Displays a Cα-trace, i.e. a thick line with a Cα atom in each corner. This is good for getting an overview of secondary structure and comparing folds.
- cartoon - Shows a nice presentation of the structure with α helices as ribbons and β strands as arrows. Good for articles and assignments.
- spheres - Displays each atom as a sphere with the correct Van der Waals radius.
- surface - Displays a surface based on the Van der Waals radius of the atoms. Note that an object / selection can have several representations at the same time, which is why it is necessary to hide existing representations when others are added (unless of course you want both at the same time). This is done using the Hide menu. In version 2.0 of PyMOL, all new structures appear as a beautiful cartoon representation with ligands in sticks and ions in spheres. In earlier versions of the program, new PDB files will often be loaded as simple lines.
Task 5: Use the Hide menu next to the global “all” object to remove everything (H-> Hide: everything).
Task 6: Experiment with the different representations of 1BL8 using the Show menu. Use the Hide menu to remove a representation before a new one appears.
The Color menu is used to set a color for an object or selection. This is most useful when making sub-selections of the structure, which we will see later. The most important functions are:
- by element - Color an object / selection by atom type, there are several different schemes, of which the classic has carbon atoms in yellow.
- by chain - Color an object / selection by chain, ie. if there are several peptide chains, then they each get their own color.
- by ss - Color an object / selection according to secondary structure.
- spectrum rainbow - Color an object / selection with a ramp from blue N terminus to red C terminus.
Task 7: Use the menus to display 1BL8 only in sticks and select atomic colors with carbon in yellow.
Task 8: Use the menus to display 1BL8 only in cartoon and select colors by secondary structure, then rainbow. Identify the correct N terminus of the protein. Why are there so many other “termini”? Use chain-specific staining to understand the quaternary structure of the K+ channel.